OUR SERVICES

Web & Backend Performance Optimisation

Every 100ms of load time costs conversions and rankings. We instrument your stack, identify the actual bottlenecks, not the assumed ones, and implement targeted fixes that move the numbers.

Next step: get your project scoped

Tell us what you are building - what exists today, what it has to do and when it has to be live. We come back with the questions we need answered and a scoped estimate instead of a range.

Describe your project

EXPERTISE

Our Tech Stack

Next.js
PostgreSQL
Redis
CDN
Lighthouse
k6

OUR APPROACH

Flexible Engagement Models

Choose the cooperation format that best fits your business goals and development velocity.

Startups

MVP Development

Fast launch to test your idea and gather user feedback with minimal investment.

What's included

  • Core feature development
  • Basic UI/UX design
  • Stable performance

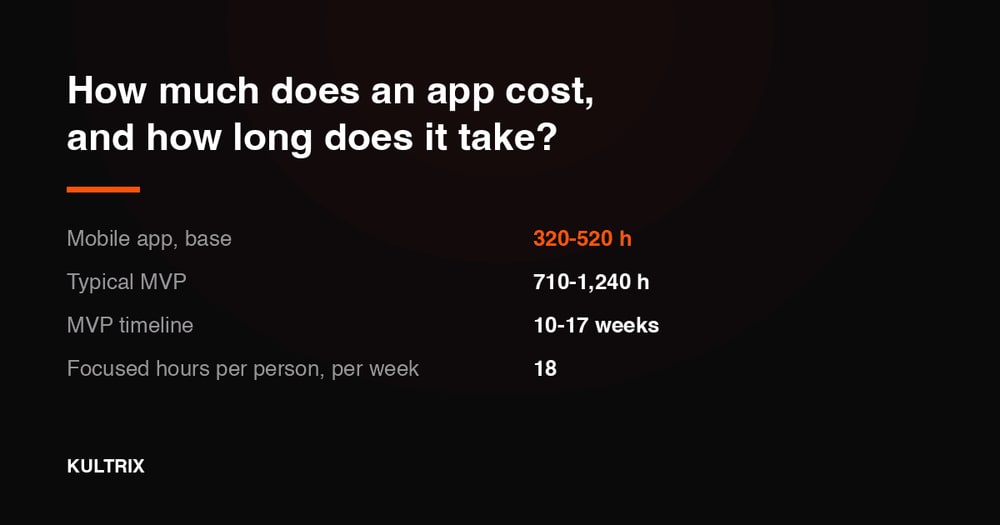
Timeline Typically 9-16 weeks

Businesses

Full App Build

Complete cycle from initial strategy and design to final launch.

What's included

  • Custom architecture & design
  • Seamless team integration
  • Production-ready release

Timeline Typically 20-40 weeks

Enterprises

Team Extension

Scale your team with expert developers to accelerate development.

What's included

  • Senior-level developers
  • Seamless team integration
  • Flexible management

Timeline Flexible / Long-term

OUR PROCESS

How We Work

We specialize in creating user-centered & innovative solutions. Delivering seamless digital experiences.

Discovery
ResearchFlow MapUser Interview
Solution
ArchitectureWireframesPrototyping
Development
Sprint CyclesCode ReviewQA Testing
Launch
DeploymentMonitoringHandoff

EXPERT INSIGHTS

Server-Side vs Client-Side Optimization

Server-side optimization reduces what is sent. Client-side optimization improves how the browser processes what arrives.

Go With Server-Side Optimization

  • Reduces bytes over the wire

    Brotli compression, image CDN transforms, and API response trimming save bandwidth.

  • Improves Time to First Byte

    Edge caching, connection pooling, and query optimization reduce TTFB to <200ms.

  • Benefits all clients equally

    Low-end devices on slow networks benefit most from smaller payloads.

  • Core Web Vitals impact

    LCP and FID directly correlate with server response speed and payload size.

Go With Client-Side Optimization

  • JavaScript bundle splitting

    Route-based code splitting reduces initial JS parse time.

  • Rendering performance

    React.memo, useMemo, and virtualization prevent unnecessary re-renders.

  • Progressive loading

    Lazy loading images and components improves perceived performance.

  • Service worker caching

    Offline-first caching strategies eliminate repeat network requests.

EXPERT GUIDANCE

CDN Edge Caching vs Application-Level Cache

CDN Edge Cache (Cloudflare / CloudFront)

Latency Reduction

Serves cached response from 200+ PoPs globally - <10ms for cached content.

Origin Offload

Cache hit rates of 90%+ eliminate origin requests entirely.

Cache Invalidation

Purge by URL, tag, or prefix - Cloudflare Cache-Tags for granular control.

Cost

Bandwidth savings offset CDN fees - often net positive.

Dynamic Content

Stale-while-revalidate and surrogate keys handle dynamic pages.

Best For

Static assets, API responses, public pages - anything cacheable.

Application Cache (Redis)

Latency Reduction

Eliminates DB query - response still travels full origin-to-user distance.

Origin Offload

Origin still handles every request - reduces DB load only.

Cache Invalidation

redis DEL or EXPIRE - fine-grained, consistent invalidation.

Cost

Redis instance cost ($15-$200/month) - cost is fixed.

Dynamic Content

Perfect for personalized data, sessions, computed aggregates.

Best For

Session data, rate limiting counters, private user-specific data.

Figures above are indicative ranges, not a quote. Anything marked as a vendor list price is that vendor's own published price, not ours. Our own work is billed at $35/hour for design and development, $20/hour for QA and $20/hour for project management, a blended $30.5/hour, the same numbers behind the cost calculator. What a project costs on top of that depends on scope, integrations and compliance.

DELIVERABLES

What You Get

Performance Audit

Performance Audit

Baseline measurements of Core Web Vitals, API latency (p50/p95/p99), and database query times using real production traffic.

Bundle Analysis

Bundle Analysis

JavaScript bundle breakdown identifying unused dependencies, duplicate code, and opportunities for code splitting.

Database Optimisation

Database Optimisation

Slow query fixes, index additions, N+1 eliminations, and connection pool tuning with before/after benchmarks.

Caching Strategy

Caching Strategy

CDN cache rules, Redis implementation for hot data, and HTTP cache headers configured across every endpoint.

Image Pipeline

Image Pipeline

Next.js Image optimisation, modern format delivery (WebP/AVIF), and Cloudinary or imgix integration for dynamic transforms.

Load Test Report

Load Test Report

k6 load test results showing throughput, latency, and error rates at 1x, 5x, and 10x your current peak traffic.

INDUSTRIES

Tailored Solutions for Your Specific Industry

We build powerful digital experiences across various sectors, ensuring your product meets unique market demands.

(01)

Fintech

Data-driven commerce solutions that improve journeys, boost sales, and optimize operations.

(02)

Retail

Data-driven commerce solutions that improve journeys, increase sales, and optimize operations.

(03)

Healthcare

Reliable medical platforms that protect patient data, simplify workflows, and support clinical accuracy.

(04)

B2B SaaS

Product-driven platforms that enhance workflows, automate processes, and scale with your business.

CASE STUDIES

Our Recent Work

View All

START YOUR PROJECT

Ready to build with expert Performance Optimisation team?

Expert developers ready to deliver high-quality digital products.

FAQ

Frequently Asked Questions

Core Web Vitals are Google's metrics for user experience: Largest Contentful Paint (LCP - how fast the main content loads), Interaction to Next Paint (INP - how quickly the page responds to input), and Cumulative Layout Shift (CLS - how much content shifts unexpectedly). Google uses them as a ranking signal, and they are strongly correlated with conversion rates. A 1-second LCP improvement increases conversions by up to 8% on e-commerce sites.

We measure against real user data (RUM) using the web-vitals library or a tool like Datadog RUM, not just synthetic Lighthouse scores. Synthetic scores are useful for direction but do not reflect what real users on real devices and connections experience. We set baseline metrics by percentile (p50, p75, p95) for each Core Web Vital and API endpoint before changing anything.

The most common LCP culprits are large unoptimised hero images, render-blocking JavaScript or CSS, slow server response times (TTFB), and missing preload hints for the LCP resource. We identify the actual LCP element in production using Chrome DevTools and RUM traces, then target the specific issue rather than applying generic optimisations.

We use webpack-bundle-analyzer or Next.js Bundle Analyzer to find the largest contributors to bundle size. Common fixes include replacing heavy libraries with lighter alternatives (e.g. date-fns instead of moment.js), converting route-level components to dynamic imports, tree-shaking icon and component libraries by switching from barrel exports to direct imports, and moving server-only code out of the client bundle.

We enable slow query logging (queries over 100ms) and run EXPLAIN ANALYSE on the heaviest queries to understand the query plan. We look for sequential scans on large tables, missing indexes, inefficient join orders, and N+1 patterns from the ORM. We then add targeted indexes, rewrite inefficient queries, and verify the improvement with before/after EXPLAIN ANALYSE output and production query logs.

We apply caching at multiple layers: HTTP cache headers (Cache-Control, ETag) for browser and CDN caching of static assets and API responses; Redis for server-side caching of expensive database queries and computed results; CDN edge caching for HTML pages using stale-while-revalidate; and in-memory caches for frequently accessed configuration that does not change per request. The correct layer depends on the data's staleness tolerance.

We convert images to WebP and AVIF (typically 30-60% smaller than JPEG at the same quality), add explicit width and height to eliminate CLS, implement lazy loading for below-fold images, and add resource hints (preload) for the LCP image. For dynamic images we use Cloudinary or imgix to serve correctly sized images based on the requesting viewport. We also audit for images served at 2x the display size.

Yes. For Next.js applications we review the rendering strategy per page - static generation, ISR, or server-side rendering - and ensure the right approach is used based on data freshness requirements. We also optimise server response time by reducing middleware overhead, moving expensive computations to build time, and implementing streaming with React Suspense to allow above-fold content to render before data-dependent sections.

We use k6 to write load test scripts that simulate realistic user behaviour - not just GET requests to the homepage. Scenarios include login, browsing, and checkout flows. We run tests at increasing concurrency levels (1x, 5x, 10x current peak) and measure latency percentiles, throughput, and error rates. We identify the breaking point and the specific resource (CPU, database connections, memory) that saturates first.

Performance and load work is a module in our estimate at 50-110 hours, which is where a focused audit and the first round of fixes land. A full engagement - load testing, caching architecture, image pipeline and database tuning - takes 4-8 weeks depending on the size of the application. We sequence the work so the first measurable improvement lands in the first week, not at the end.

Results vary by starting point, but common outcomes include: LCP improving from 4s to under 2.5s (passing Core Web Vitals), API p95 latency dropping 40-70% after query optimisation, JavaScript bundle size reducing 30-50% through code splitting and dependency trimming, and cloud costs dropping 20-30% after right-sizing and caching reduce compute demand. We set specific targets before starting and measure against them.

Yes. We configure real user monitoring with alerts for Core Web Vital regressions, API latency spikes, and error rate increases. We also set up a performance budget in CI that fails the build if a new dependency would push the JavaScript bundle over an agreed size limit. For clients on retainers we include a monthly performance review covering trends and emerging bottlenecks.