OUR SERVICES

Conversion Optimization - More Revenue, Same Traffic

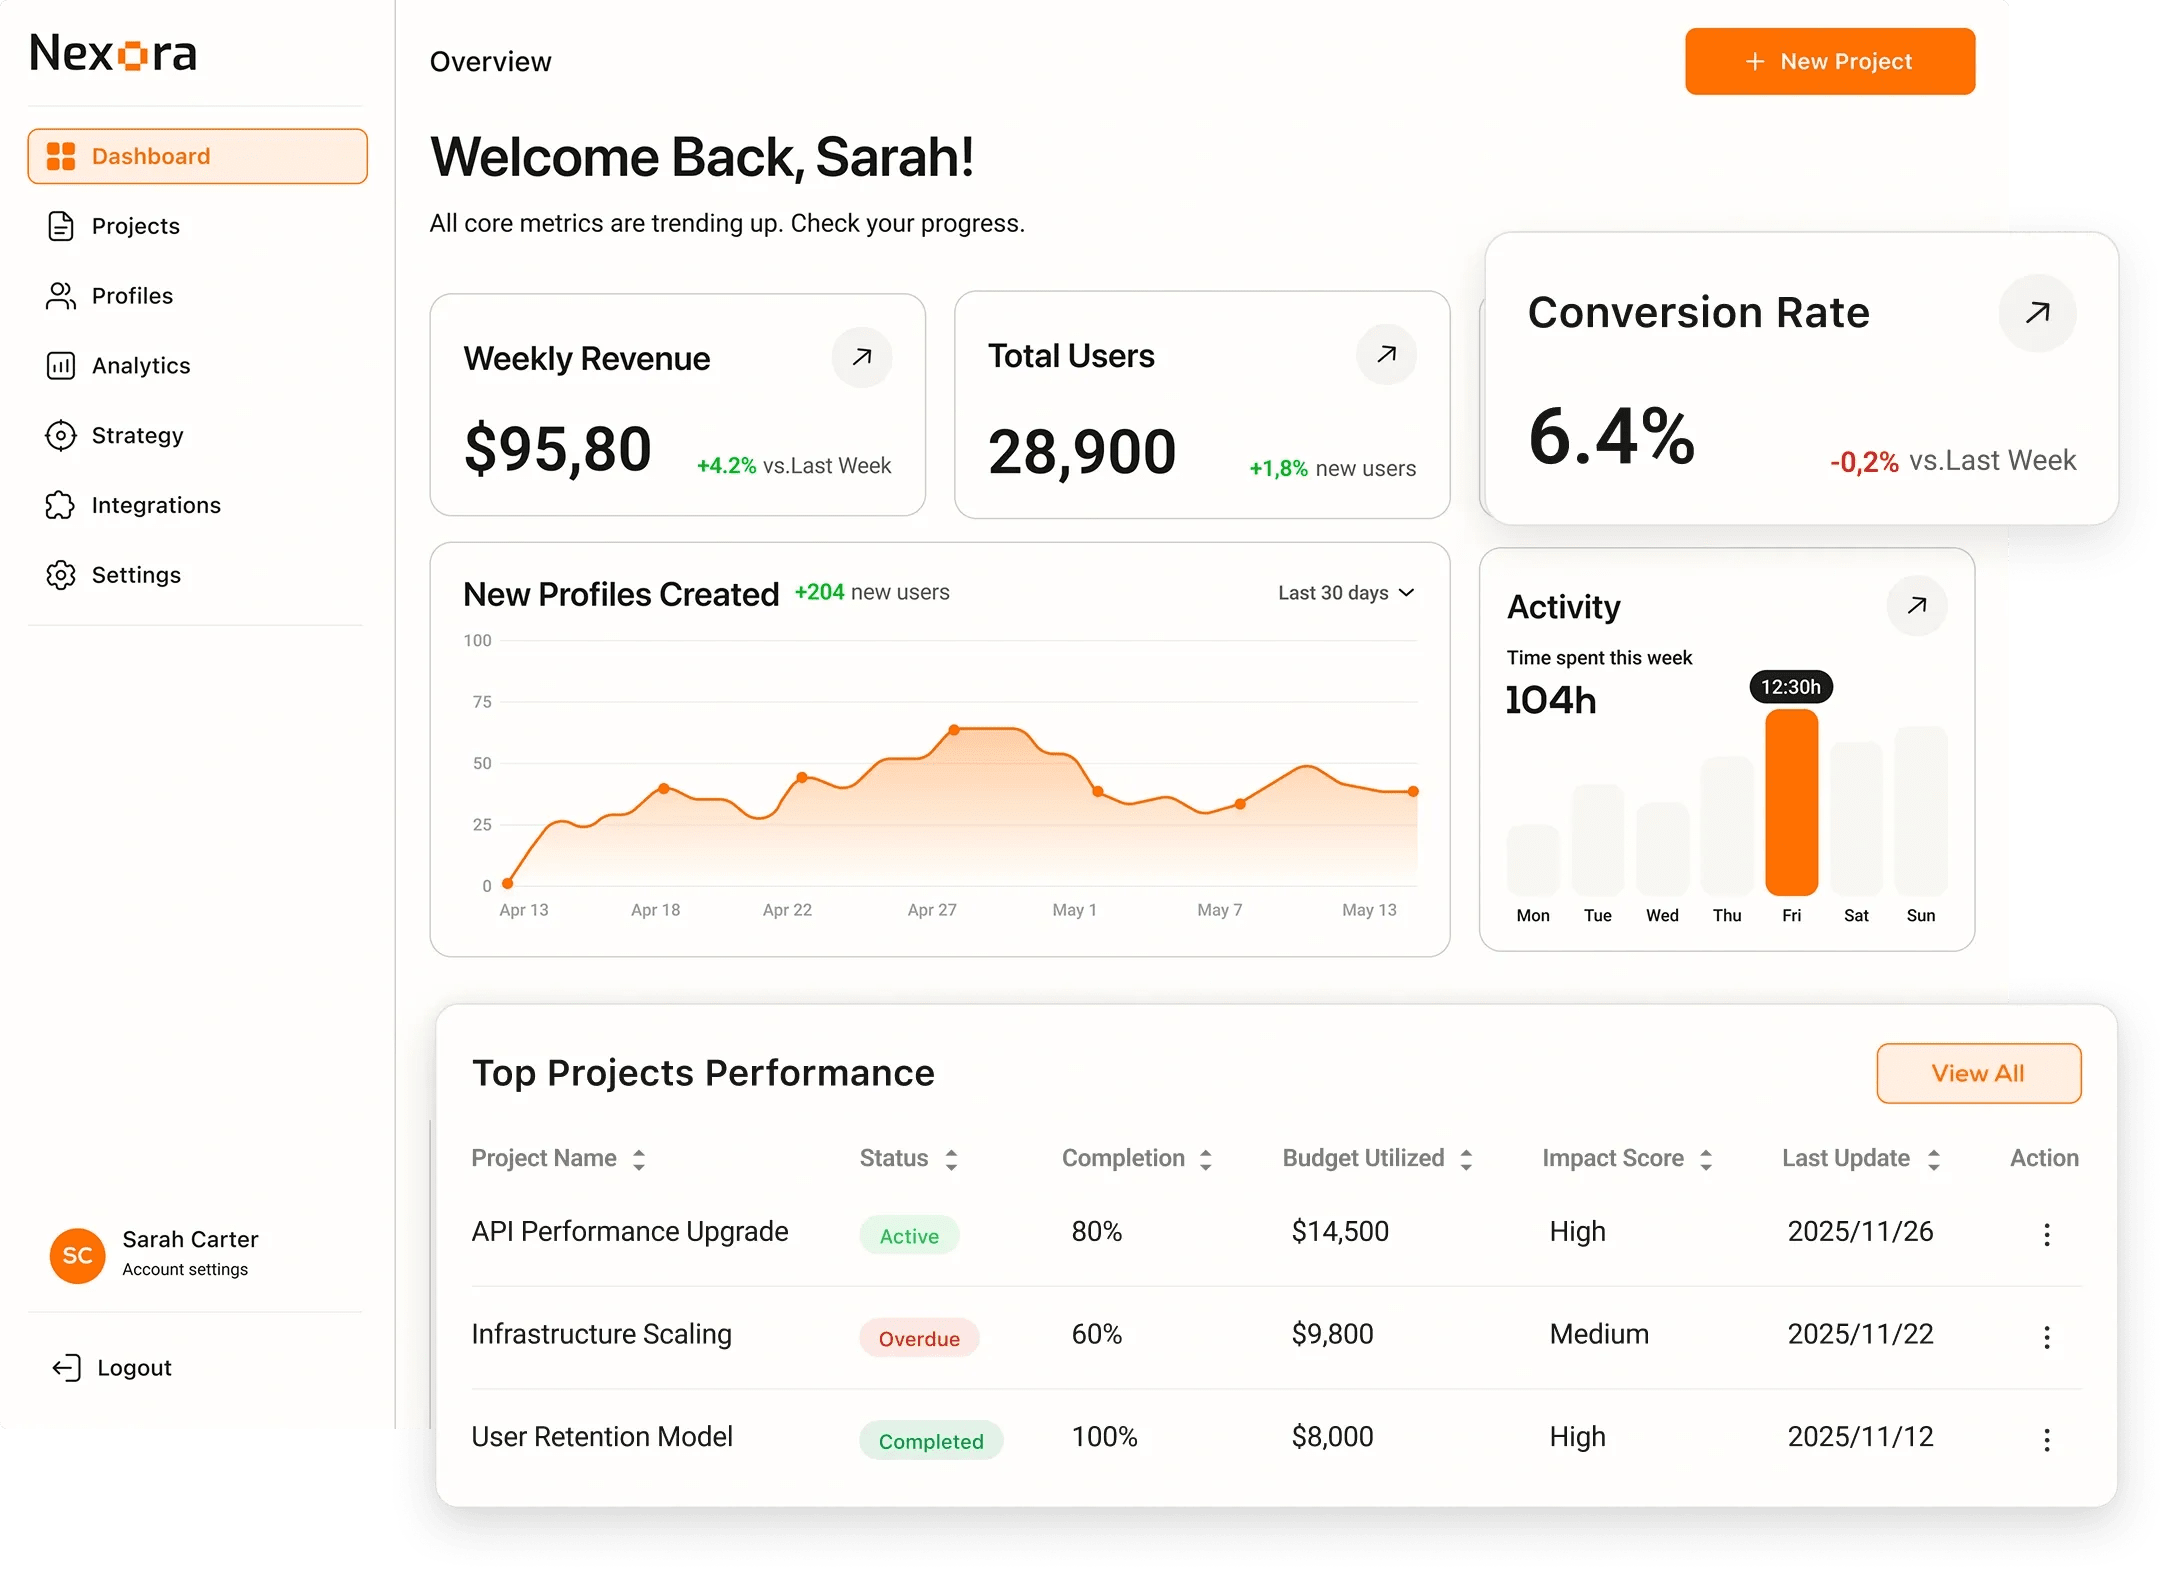
Every percentage point of conversion rate improvement multiplies revenue from your existing traffic.

Next step: get your project scoped

Tell us what you are building - what exists today, what it has to do and when it has to be live. We come back with the questions we need answered and a scoped estimate instead of a range.

Describe your project

EXPERTISE

Our Tech Stack

A/B Testing
Hotjar
Google Analytics
VWO
Figma
Copywriting

OUR APPROACH

Flexible Engagement Models

Choose the cooperation format that best fits your business goals and development velocity.

Startups

MVP Development

Fast launch to test your idea and gather user feedback with minimal investment.

What's included

  • Core feature development
  • Basic UI/UX design
  • Stable performance

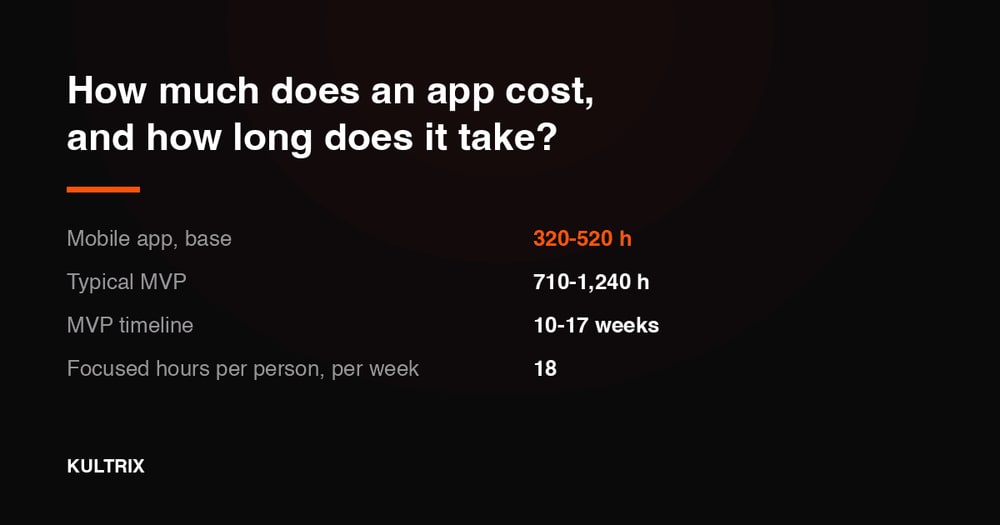
Timeline Typically 9-16 weeks

Businesses

Full App Build

Complete cycle from initial strategy and design to final launch.

What's included

  • Custom architecture & design
  • Seamless team integration
  • Production-ready release

Timeline Typically 20-40 weeks

Enterprises

Team Extension

Scale your team with expert developers to accelerate development.

What's included

  • Senior-level developers
  • Seamless team integration
  • Flexible management

Timeline Flexible / Long-term

OUR PROCESS

How We Work

We specialize in creating user-centered & innovative solutions. Delivering seamless digital experiences.

Discovery
ResearchFlow MapUser Interview
Solution
ArchitectureWireframesPrototyping
Development
Sprint CyclesCode ReviewQA Testing
Launch
DeploymentMonitoringHandoff

EXPERT INSIGHTS

Quantitative vs Qualitative CRO

Quantitative data shows you where users drop off. Qualitative data tells you why - and what to actually change.

Go With Quantitative CRO (A/B Testing)

  • Statistical certainty

    Bayesian or frequentist significance testing removes guesswork from decisions.

  • Measurable revenue impact

    Directly attribute conversion lift to specific changes - $X per 1% improvement.

  • Continuous improvement loop

    Winning variants become the baseline - iterative compounding gains over time.

  • Scales across traffic segments

    Segment by device, source, and user cohort to find hidden conversion differences.

Go With Qualitative CRO (Heatmaps / Interviews)

  • Hypothesis generation

    Heatmaps and session recordings reveal where users hesitate or abandon.

  • Small traffic budgets

    No minimum sample size - works even with 1,000 monthly visitors.

  • Emotional insight

    User interviews surface objections and trust barriers A/B tests miss.

  • Fast turnaround

    Insights from 5 user sessions available in 48 hours.

EXPERT GUIDANCE

A/B Testing vs Multivariate Testing

A/B Testing

Traffic Required

Test one change - needs 5K-20K visitors for significance.

Insight Clarity

Clear winner - one variable changed, one cause for improvement.

Implementation Speed

Simple variant to build and QA - ship in hours.

Learning Value

Builds team intuition for what moves the needle.

Risk

Low - only one change in production at a time.

Best For

Most CRO programs, teams under 1M monthly visitors.

Multivariate Testing

Traffic Required

Tests all combinations - needs 10x more traffic for same confidence.

Insight Clarity

Interaction effects between variables - complex analysis required.

Implementation Speed

N×M combinations to build and test - longer setup.

Learning Value

Finds optimal combination - less insight into individual element impact.

Risk

Medium - many variants live simultaneously.

Best For

High-traffic sites testing layout variations (hero section, pricing page).

DELIVERABLES

What You Get

CRO Audit

CRO Audit

Heuristic review of your key conversion flows with a ranked list of friction points and opportunity estimates.

Behavioral Analysis

Behavioral Analysis

Heatmaps, session recordings, and funnel analysis that reveal exactly where and why users abandon.

A/B Test Roadmap

A/B Test Roadmap

Prioritized experiment backlog with hypotheses, variants, sample size, and success criteria defined.

Test Implementation

Test Implementation

Development and QA of A/B test variants in your preferred testing platform with statistical rigor.

Rollout & Iteration

Rollout & Iteration

Permanent implementation of winning variants with documentation of learnings for future campaigns.

Performance Dashboard

Performance Dashboard

Real-time conversion tracking by traffic source, device, and segment with monthly trend commentary.

INDUSTRIES

Tailored Solutions for Your Specific Industry

We build powerful digital experiences across various sectors, ensuring your product meets unique market demands.

(01)

Fintech

Data-driven commerce solutions that improve journeys, boost sales, and optimize operations.

(02)

Retail

Data-driven commerce solutions that improve journeys, increase sales, and optimize operations.

(03)

Healthcare

Reliable medical platforms that protect patient data, simplify workflows, and support clinical accuracy.

(04)

B2B SaaS

Product-driven platforms that enhance workflows, automate processes, and scale with your business.

CASE STUDIES

Our Recent Work

View All

START YOUR PROJECT

Ready to build with expert Conversion Optimization team?

Expert developers ready to deliver high-quality digital products.

FAQ

Frequently Asked Questions

CRO is the systematic process of increasing the percentage of visitors who complete a desired action - a purchase, sign-up, demo request, or phone call. It uses data analysis, user research, and controlled experiments to find and fix friction in the user journey without requiring more traffic.

A/B testing requires at least 1,000-2,000 monthly conversions per variant to reach statistical significance in a reasonable timeframe. With lower traffic, we focus on qualitative research (user interviews, session recordings) and high-confidence UX improvements that do not require controlled experiments.

Quick wins from UX fixes and copy changes can show measurable lift within 2-4 weeks. A structured A/B testing program typically runs 4-8 week test cycles. Clients who commit to a 3-month program commonly see 20-40% aggregate improvement in conversion rates across their main flows.

We start with the highest-impact pages in your conversion funnel: the homepage, primary landing pages, pricing page, and checkout or sign-up flow. We identify these using your analytics data - focusing effort where volume and drop-off rates create the largest revenue opportunity.

Yes. Our team includes conversion copywriters who specialize in value proposition clarity, objection handling, and CTA optimization. Copy often produces the highest-impact test results because it directly addresses the user's decision-making process.

We run tests to a pre-calculated sample size at 95% confidence intervals, avoid peeking at results early, and account for multiple testing corrections. We also check for novelty effects by analyzing conversion behavior across the full test duration before calling a winner.

No. Properly implemented A/B tests use Google-recommended techniques that are invisible to crawlers. Winning variants are implemented directly in the production codebase with standard HTML, and we ensure all SEO metadata is preserved or improved during the rollout.

We use Hotjar and Microsoft Clarity for behavioral analytics, VWO or Google Optimize for A/B testing, Google Analytics 4 for funnel analysis, and Figma for designing test variants. We can also work within your existing tool stack if preferred.

Absolutely. E-commerce is one of the highest-ROI applications of CRO. We optimize product page layouts, cart and checkout flows, upsell and cross-sell placement, and trust signal positioning. Even a 1% lift in add-to-cart rate compounds significantly at scale.

For clients with sufficient traffic, we move beyond single-winner tests into audience segmentation and personalized experiences - showing different headlines or offers to returning visitors versus new ones, or to users from different traffic sources. We implement this through your existing CMS or a lightweight personalization layer.

Yes. We always segment test results by device type. Mobile users often have significantly different conversion barriers than desktop users - tap target size, form complexity, page speed on cellular networks - and we run mobile-specific experiments to address them.

We track conversion rate change, average order value, revenue per visitor, and lead quality alongside experiment results. At the end of each engagement we provide a revenue impact report that calculates the annualized value of improvements shipped, making the ROI of the program explicit.